
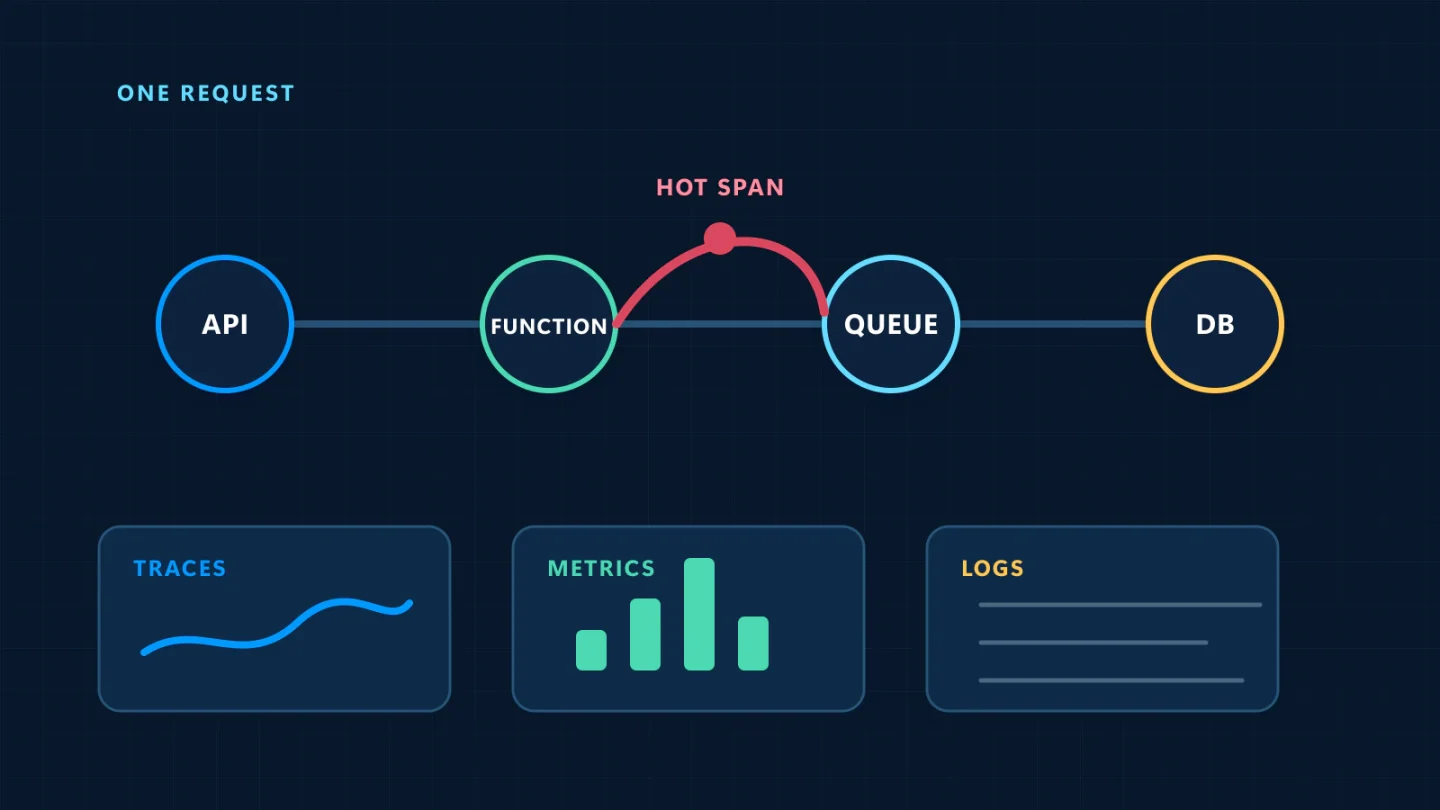
Serverless applications remove servers from the team’s daily workload, but they do not remove operational responsibility. A function can be healthy while the customer journey is failing. An API can return quickly while an event is aging in a queue. A retry can hide a transient fault while multiplying cost. Useful observability starts with those outcomes, then connects them to the telemetry that explains what happened.
The goal is not to collect every signal Amazon CloudWatch can display. It is to answer a small set of operational questions quickly: Are users succeeding? Is the system keeping up? Where is time being spent? Are failures contained and recoverable? Has a deployment changed behavior? Is usage creating an unexpected bill? A practical design connects metrics, structured logs, traces, alarms, and runbooks around those questions.
Begin with a service journey, not a resource list
Draw one representative path through the application. For an HTTP workflow, that might be client, API Gateway, Lambda, a database, and a downstream service. For an event-driven workflow, it might be producer, Amazon SQS, Lambda consumer, destination, and dead-letter queue. Name the success condition and the maximum acceptable completion time before selecting metrics.
This creates three layers of signals:
- Outcome signals describe what the user or business received: completed orders, accepted submissions, generated documents, or events processed within a target time.
- Service signals describe the experience: availability, error rate, end-to-end latency, backlog age, and correctness.
- Resource signals help explain a change: Lambda errors, duration, throttles, concurrency, API integration latency, or a queue that is not draining.
Resource metrics without an outcome can produce a reassuring dashboard for a broken service. Outcome metrics without diagnostic detail can prove that something is wrong but leave responders guessing. Keep both.
Monitor Lambda as rates and distributions
AWS publishes Lambda metrics to CloudWatch automatically. The most useful baseline is not a wall of raw totals; it is a set of rates, percentiles, and capacity indicators interpreted in context.
- Invocations establish workload volume. Compare the current period with an expected range and with the upstream request or event count.
- Error rate is
Errors / Invocations, evaluated alongside the total number of invocations. One error in two calls and one error in two million calls should not page the same way. - Duration percentiles reveal the slow tail hidden by an average. Watch a high percentile such as p95 or p99 and compare it with the function timeout and the workflow’s latency target.
- Throttles are rejected invocation requests and are not counted as either invocations or function errors. A dashboard that watches only errors can therefore miss capacity pressure.
- ConcurrentExecutions and account-level concurrency show proximity to reserved or regional limits. Use the maximum statistic when the question is whether capacity was exhausted.
- AsyncEventsDropped, DestinationDeliveryFailures, and DeadLetterErrors matter for asynchronous processing. A successful function invocation is not the same as successful delivery of its result.
Segment these views by function, version, or alias where appropriate. A deployment can make a small percentage of traffic fail while the aggregate remains deceptively calm. Put deployment annotations or version identifiers next to the graphs so a change in telemetry has an immediate candidate cause.
Measure the API boundary separately
For an HTTP API, API Gateway provides a customer-facing boundary. Watch request count, 4xx and 5xx responses, total Latency, and IntegrationLatency. AWS defines total latency as the time from receipt of the client request until API Gateway returns a response; integration latency covers the portion spent waiting for the backend.
The difference is diagnostically useful. If both rise, investigate the integration and its dependencies. If total latency rises while integration latency remains stable, inspect gateway configuration, authorization, transformations, or other work at the boundary. Treat 4xx responses carefully: some are expected client behavior, while a sudden increase can indicate a broken client release, authorization problem, missing route, or abuse. Alert on a sustained, material change rather than every isolated response.
Detailed per-route metrics can make diagnosis faster, but AWS notes that enabling detailed metrics can add cost. Start with stage-level indicators, then add route-level detail for critical paths or recurring ambiguity.
For queues, age is often more important than depth
A queue can contain many messages and still be healthy if consumers are keeping pace. It can contain relatively few messages and still violate a time-sensitive commitment. Track ApproximateNumberOfMessagesVisible for backlog size and ApproximateAgeOfOldestMessage for delay. Interpret them together with arrival rate, deletion rate, consumer errors, Lambda throttles, and concurrency.
A rising oldest-message age is a strong signal that work is not completing at the required speed. A growing visible-message count with stable age may be a short burst the consumers can absorb. A flat backlog with steadily rising age can reveal a poison message or stalled consumer. AWS explains that several SQS metrics are approximate because SQS is distributed, so use them for operational trends rather than exact accounting.
A dead-letter queue also needs monitoring. Alarm when messages arrive, record the source queue and failure category, and define who investigates, how the message is inspected safely, and what permits a redrive. Do not treat a DLQ as durable success storage. It is a containment mechanism and an explicit signal that the normal path failed.
Make logs structured, correlated, and safe
Logs should let a responder reconstruct one execution without searching for prose fragments. Lambda supports JSON-formatted system logs and, for supported runtimes and logging methods, JSON application logs. A consistent event should include a timestamp, severity, service, environment, function version, correlation or request ID, operation, outcome, duration, dependency name, retry count, and a stable error category.
Use fields rather than embedding everything in a message string. Then CloudWatch Logs Insights can group failures by error_type, compare latency by operation, or trace one correlation_id across components. Propagate that identifier through API requests, messages, and downstream calls. When an event is retried, retain the workflow identifier and add an attempt number instead of generating an unrelated story.
Never log secrets, authorization headers, session tokens, full form submissions, or regulated records. Mask or omit sensitive fields at the logging boundary. Limit log access, define retention, and sample high-volume success events where full capture has little diagnostic value. Structured logging can increase message size, so review ingestion and retention cost as part of the design.
Use traces to explain time across boundaries
Metrics tell you that latency changed; traces can show where the time went. With active AWS X-Ray tracing, Lambda creates trace segments for sampled invocations. Instrument meaningful downstream work so traces can distinguish initialization, handler execution, database calls, HTTP calls, and queue transitions.
Tracing is most useful when context survives service boundaries and the team has a question it expects traces to answer. Sample enough normal traffic to establish a baseline and retain more error or slow-request traces where the tooling permits. Do not assume every invocation must be traced. Sampling, indexing, and retention have cost and data-handling implications.
For asynchronous systems, a trace may not represent a single uninterrupted request. Pair trace identifiers with durable workflow and message identifiers in structured logs. That makes retries, fan-out, and delayed consumers understandable even when one end-to-end trace is incomplete.
Alarm on action, not curiosity
An alarm deserves an owner and a response. If crossing a threshold does not require timely action, it belongs on a dashboard or in a report rather than in the paging path.
A compact starting alarm set might include:
- sustained user-visible error rate above an agreed threshold;
- high-percentile API latency breaching the service target;
- Lambda throttles on a critical synchronous path;
- queue oldest-message age approaching the processing deadline;
- any new message on a critical dead-letter queue;
- asynchronous events dropped or destination delivery failures;
- no successful canary or business transaction during a period when traffic is expected; and
- an unexpected spend signal requiring cost investigation.
Configure missing-data behavior deliberately. An error metric that emits only on failure should not page because there was no error data, while a continuous heartbeat that disappears may need to be treated as breaching. Use multiple evaluation periods to resist one-point noise. Composite alarms can group related symptoms and reduce duplicate notifications, but they should not hide the underlying state from responders.
Every page should include the affected service and environment, the observed value, a link to the relevant dashboard and logs, recent deployment information, and a short runbook. Test the notification path. An alarm that exists in infrastructure code but cannot wake the right person is documentation, not monitoring.
Treat cost as an operational signal
Serverless cost follows activity. A recursive invocation, retry storm, noisy log statement, unexpectedly large API response, or stalled consumer can become a financial symptom before it becomes an outage. Track invocations, compute duration, provisioned concurrency where used, API requests, data processed, queue operations, trace volume, and log ingestion and retention.
AWS Cost Anomaly Detection can identify unusual spend patterns, but AWS documents a processing delay and notes that detection is not real time. Use it as a financial safety net, not as the only control for a rapidly multiplying workload. Pair it with resource metrics, quotas, reserved concurrency, bounded retries, maximum event age, and application safeguards that limit runaway work.
A dashboard should support a five-minute assessment
The first screen should answer whether the service is available, correct, timely, keeping up, and operating within expected usage. Organize it by journey rather than AWS product:
- Outcome volume and success rate.
- API request rate, error rate, and latency percentiles.
- Function errors, duration, throttles, and concurrency.
- Queue depth, oldest-message age, and dead-letter activity.
- Dependency failures and latency.
- Recent deployments and configuration changes.
- Usage and cost indicators.
From each graph, link to a filtered log query or trace view. A dashboard that makes the operator manually re-enter function names, time ranges, and identifiers increases recovery time.
A practical rollout sequence
- Define two or three service outcomes. Choose a success ratio and completion-time target for each.
- Standardize context. Add environment, service, version, request or workflow ID, outcome, and error category to structured logs.
- Build one journey dashboard. Include the API, functions, queues, destinations, and deployment markers that serve the outcome.
- Create only the critical alarms. Assign owners, routes, and runbooks; test delivery.
- Instrument the unknowns. Add custom metrics or tracing only where the first incident review shows a real diagnostic gap.
- Review monthly and after incidents. Remove noisy signals, tune thresholds, and add the telemetry that would have shortened diagnosis.
Teams planning a broader operating model can connect these practices to Managed Cloud Operations. For architecture decisions that determine service boundaries and failure containment, see Cloud Strategy and Architecture. Logging access, retention, and alert permissions should also align with Cloud Security and Governance.
Observability is successful when a responder can move from customer impact to the responsible component and a safe next action without guessing. If you need help defining that baseline for a serverless workload, start a conversation with Bluegrass Cloud.
Sources
- AWS Lambda: Types of metrics for Lambda functions
- AWS Lambda: Configuring JSON and plain text log formats
- Amazon API Gateway: Monitor CloudWatch metrics for HTTP APIs
- Amazon SQS: Available CloudWatch metrics
- AWS Lambda: Visualize function invocations using AWS X-Ray
- AWS Cost Management: Detecting unusual spend with AWS Cost Anomaly Detection